Data Science for Software Engineers: Why the Microsoft '10-Week, 20-Lesson' Repo is Your Next Big Project
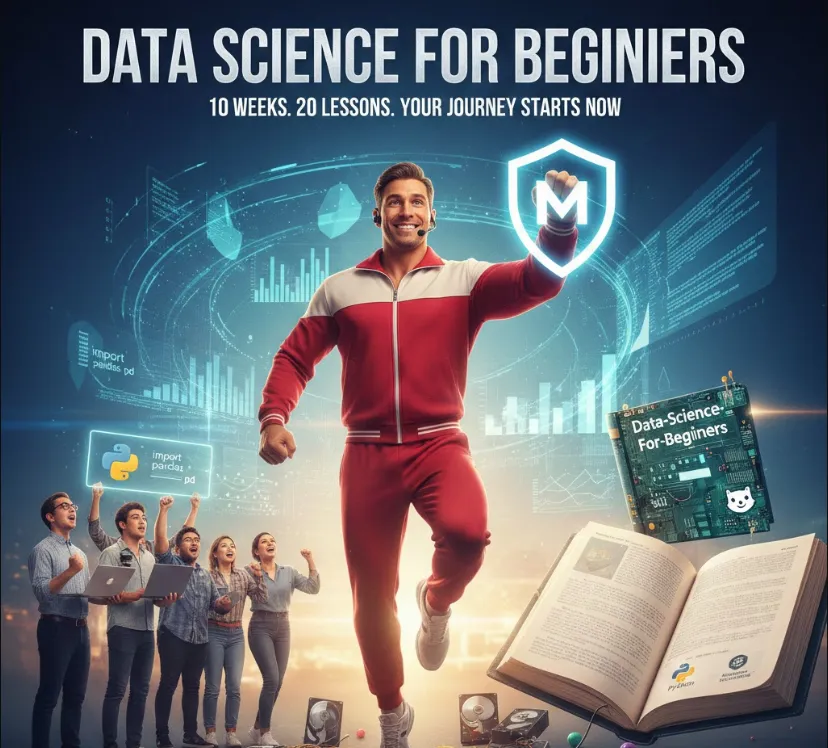
microsoft/Data-Science-For-Beginners
You've pointed out a fantastic resource. The Microsoft "Data Science for Beginners" curriculum is a goldmine, especially for software engineers looking to pivot or add a data-centric edge to their skill set.
Here is a breakdown of why this matters to us and how you can get started.
As engineers, we are used to deterministic logic
if X, then Y. Data science introduces us to probabilistic thinking. This repo is helpful because
Production-Ready Mindset
It doesn't just teach math; it teaches how to handle data pipelines, which is crucial for building data-driven features in apps.
Tooling Familiarity
It leans heavily on Python and Pandas—tools that fit right into a standard dev workflow.
Structured Learning
Instead of random tutorials, it offers a 10-week "curriculum" style, which helps in building a solid foundation rather than just copying snippets.
Since you're already comfortable with code, don't just read the Markdown files. Treat it like a project
Fork and Clone
Fork the microsoft/Data-Science-For-Beginners repo to your own GitHub.
Environment Setup
Don't clutter your global Python path. Use a virtual environment or a Dev Container.
python -m venv ds-env
source ds-env/bin/activate  # On Windows: .\ds-env\Scripts\activate
pip install pandas matplotlib jupyter
Use Jupyter Notebooks
Most lessons are in .ipynb files. Use the VS Code Jupyter extension to run cells interactively.
One of the core skills in the "Data Science for Beginners" course is mastering Pandas. Think of Pandas as "SQL for Python" or "Excel on steroids."
Here’s a sample of how you might use it to analyze a simple dataset—something you might do when debugging logs or analyzing user behavior.
import pandas as pd

# 1. Create a DataFrame (Like a table in memory)
data = {
    'Project': ['App A', 'App B', 'App C', 'App A', 'App B'],
    'Bugs_Found': [12, 5, 8, 7, 15],
    'Status': ['Shipped', 'Beta', 'Shipped', 'Shipped', 'Dev']
}

df = pd.DataFrame(data)

# 2. Filter data: Find all 'Shipped' projects with more than 10 bugs
critical_apps = df[(df['Status'] == 'Shipped') & (df['Bugs_Found'] > 10)]

print("Critical Shipped Apps:")
print(critical_apps)

# 3. Grouping: Get the average bugs per status
avg_bugs = df.groupby('Status')['Bugs_Found'].mean()
print("\nAverage Bugs by Status:")
print(avg_bugs)
The repo is divided into logical chunks that make sense for a developer's progression
| Weeks | Focus | Key Takeaway |
| 1-2 | Introduction & Ethics | Why data matters and how to handle it responsibly. |
| 3-4 | Data Preparation | Cleaning "dirty" data (the hardest part of the job!). |
| 5-6 | Visualization | Turning raw numbers into charts using Matplotlib/Seaborn. |
| 7-10 | Specific Domains | Real-world applications like Natural Language Processing (NLP). |
This repo is a "Project-Based" curriculum, meaning there are quizzes and assignments. If you want to dive in right now, I'd suggest starting with the "Data Cleaning" section in Week 3—it's where your engineering skills in logic and edge-case handling will shine the most.