Next-Gen Data Viz: Implementing AI-Driven Infographics in Your Web Apps
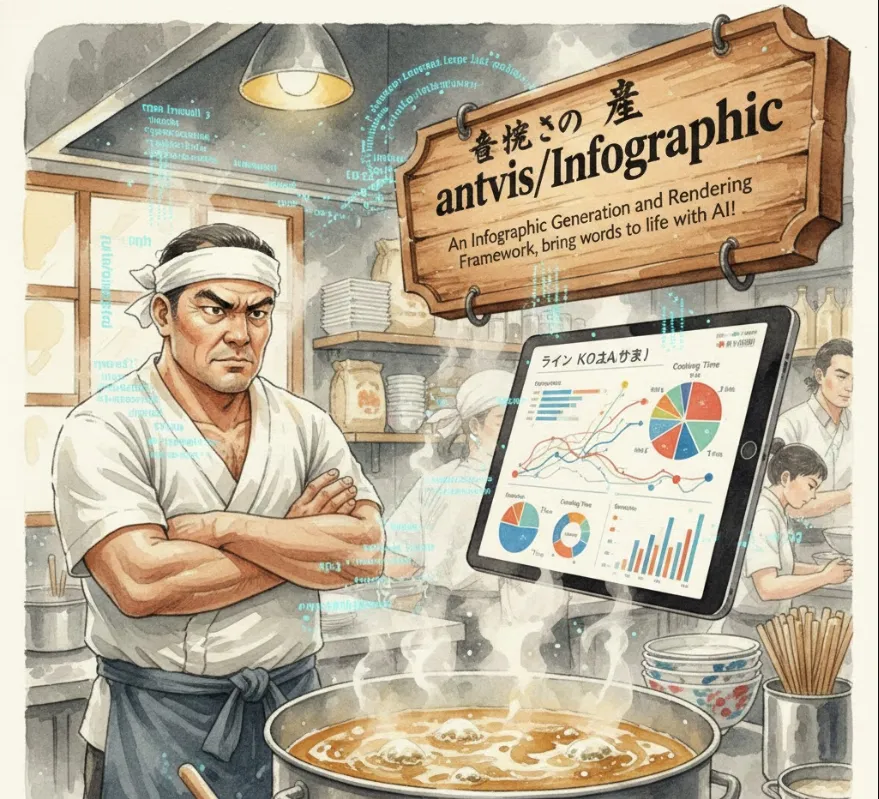
Infographics have always been a bit of a "pain point" in development. Usually, you either have to hard-code complex SVG layouts (which is tedious) or rely on designers to export static images (which isn't dynamic). This framework changes the game by using AI to bridge the gap between raw data and visual storytelling.
Here is a breakdown of why this is a big deal for us and how you can get started.
From a technical perspective, this isn't just a "chart library." It’s an intelligent layout engine. Here’s why it’s useful
Dynamic Content Generation
Instead of building a fixed dashboard, you can feed the framework a stream of data or text, and it determines the best visual structure.
Scalability
You can generate hundreds of unique, high-quality visuals for reports or social media automation without manual design work.
Cross-Platform Consistency
Since it’s part of the AntV ecosystem (by Alibaba), it’s built on robust rendering foundations (G2/G6), ensuring it works well across different web environments.
Since this is an AntV project, it integrates smoothly into modern JavaScript/TypeScript workflows. You can install it via npm or yarn
npm install @antv/infographic --save
The beauty of this framework is its declarative nature. You define the intent, and the library handles the rendering. Here is a simplified example of how you might initialize a basic infographic component.
import { Infographic } from '@antv/infographic';

// 1. Define your data or "story"
const data = {
  title: "Monthly User Growth",
  items: [
    { label: "January", value: 120, icon: 'user' },
    { label: "February", value: 250, icon: 'trend-up' }
  ]
};

// 2. Initialize the framework
const infoChart = new Infographic({
  container: 'container-id', // The ID of your HTML element
  width: 800,
  height: 600,
  autoFit: true,
});

// 3. Render the visual
infoChart.data(data);
infoChart.render();
Pro-Tip
If you want to use the AI features (like "words to life"), you typically integrate an LLM (Large Language Model) API key to translate natural language descriptions into the JSON schema that this library understands.
Automated Reports
Turn a user's monthly spending data into a beautiful, shareable infographic PDF.
AI Chatbots
When a user asks "Show me the breakdown of my tasks," the bot can return a rendered infographic instead of just a boring table.
CMS Integration
Allow non-technical content creators to type a sentence and have the website automatically generate a matching visual.
AntV's Infographic framework is a powerful tool because it moves us away from "drawing shapes" toward "visualizing ideas." It saves us hours of CSS/SVG wrestling and lets us focus on the data logic.